Oracle Cloud Infrastructure - Logging and Monitoring for OKE
Introduction
Oracle Kubernetes Engine (OKE) is a fully-managed container orchestration service that simplifies the deployment and management of containerized applications in the Oracle Cloud Infrastructure(OCI). OKE is built on top of Kubernetes, the popular open-source container orchestration platform, and provides enterprise-grade features such as high availability, scalability, and security. In a complex and dynamic environment like OKE, logging and monitoring play a crucial role in ensuring the health and stability of the system. By collecting and analyzing logs and metrics from various sources, such as containers, nodes, and network, OKE administrators can gain insights into the behavior of the system and identify issues before they become critical. Logging and monitoring can also help to optimize resource utilization, troubleshoot performance issues, and meet compliance and security requirements. Therefore, effective logging and monitoring are essential components of any OKE deployment.
In this blog, we’ll explore the logging and monitoring strategy to gain operations insights from all three tiers of OKE(Infrastructure tier, Kubernetes platform tier, Application tier), and more importantly to understand the cost impact to our existing cloud consumption.
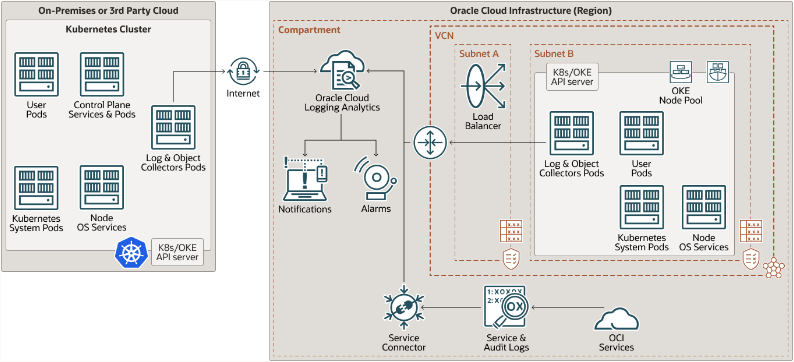
Logging architecture
The logging architecture on OKE typically involves two main components: Fluentd-based Agent and Management Agent.
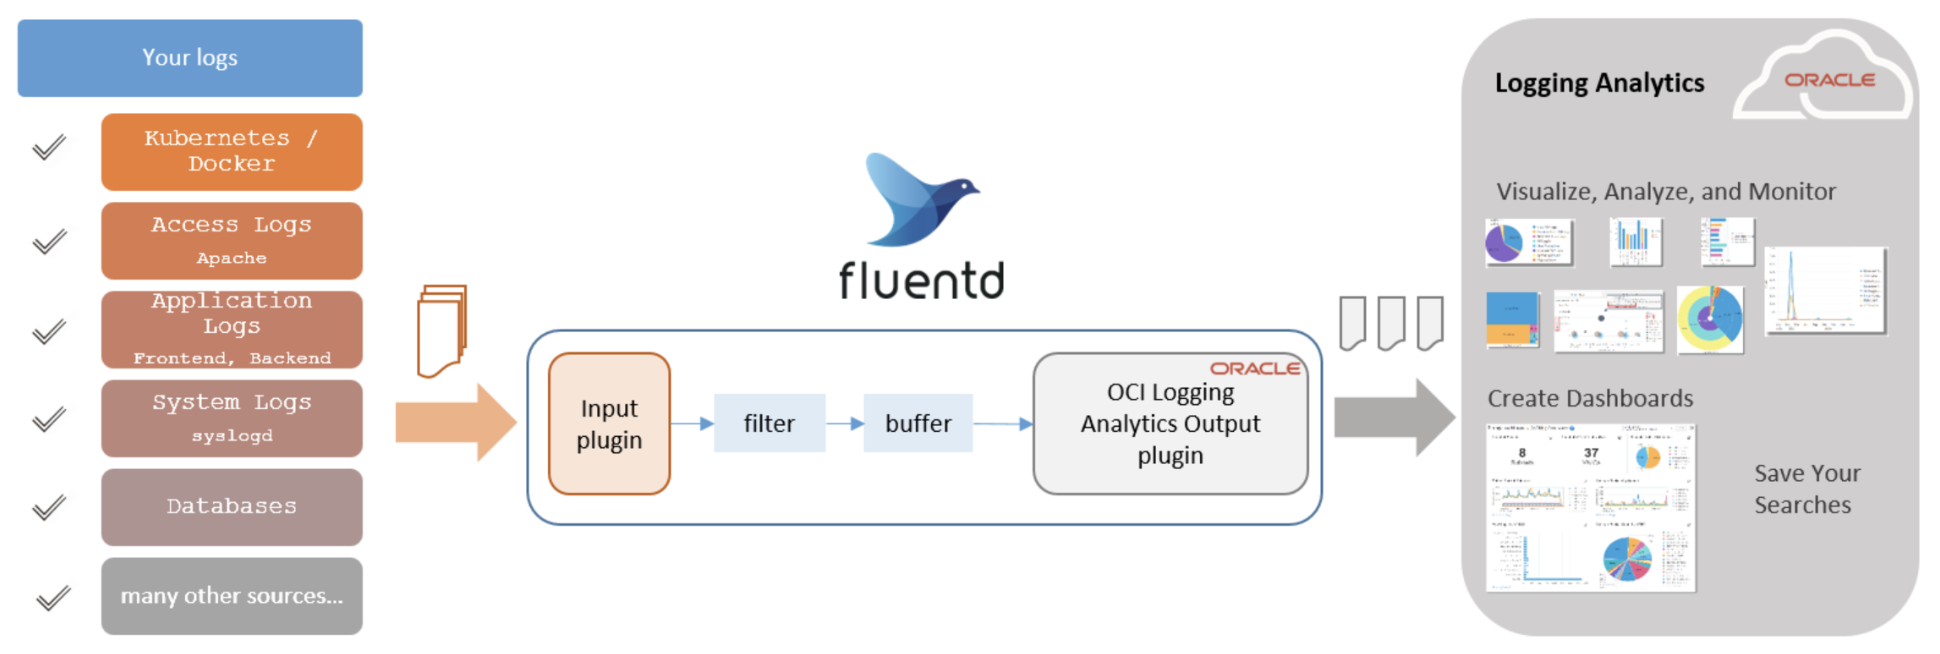
Fluentd-based Agent
Fluentd is an open-source data collector that provides a unified logging layer between data sources and monitoring systems. It allows unified data collection and consumption to build data processing pipelines for a better use and understanding of log data.
We will use containerized Fluentd-based Agent that runs as DaemonSet and ReplicatSet on Kubernets cluster for logs collection, with one instance running on each node. It uses logging analytics Fluentd output plugin to ingest logs to Oracle Cloud Logging Analytics service.
Example of the log types :
- Kubernetes Container Generic logs
- Linux Syslogs
- Kubelet logs
- Kubernetes Objects logs
- Linux Audit
- Custom Application logs
- VNC Flow logs
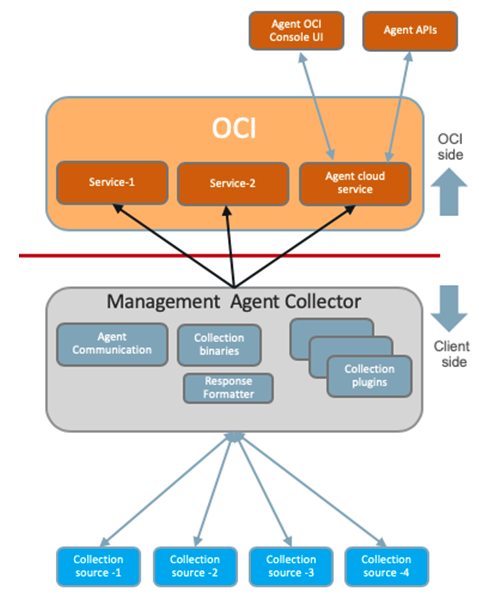
Management Agent
Management Agent is Oracle data collector and Prometheus scraper installed on compute instances to monitor and collect metrics data for services and sources to enable end-to-end monitoring and management. The Management Agent uses service plug-ins to interact with data sources and send the database back to OCI Management Agent Cloud Service.
Service Plug-ins :
- Stack Monitoring
- Logging Analytics
- Database Management and Operations Insights Service
- Operations Insights Host Service
- Java Usage Tracking
A containerized Management Agent that runs as StatefulSet on Kubernets cluster for metrics collection for the Kubernetes Cluster as well as custom application related metrics. Like Fluenntd-based agent deployment, it will use Logging Analytics Plug-in to ingest into OCI Logging Analytics Service.
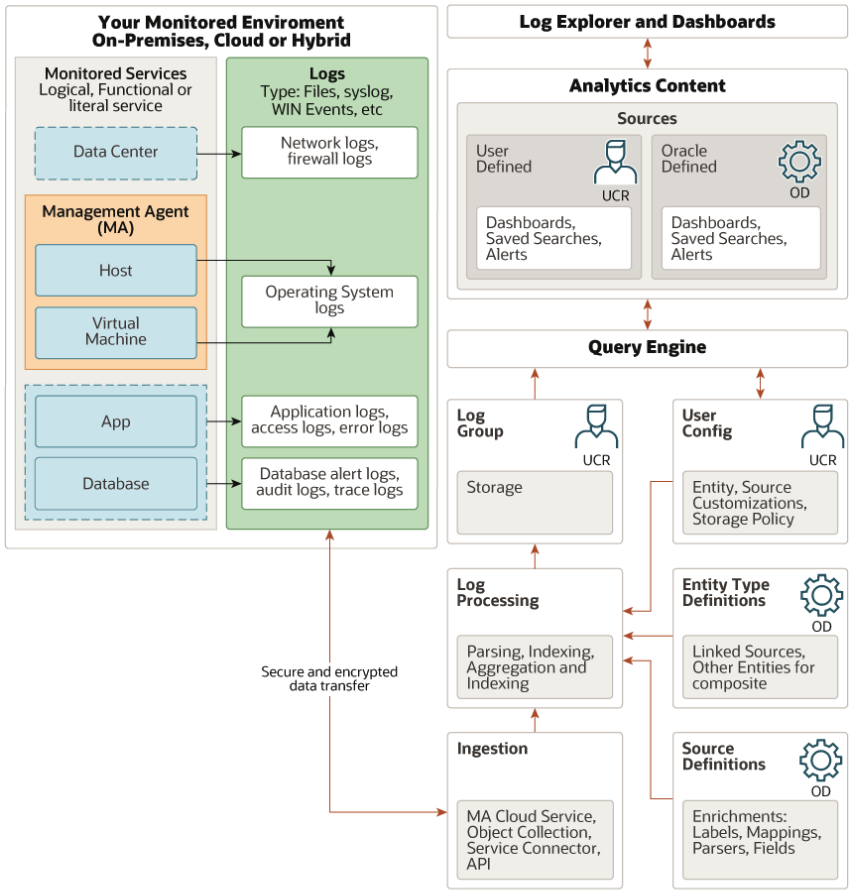
Monitoring Architecture
We designed the Logging and Monitoring solution for OKE around OCI Logging Analytics(LA) for end-to-end Kubernetes monitoring solution for underlying infrastructure, Kubernetes platform and cloud native applications. Logging Analytics is a cloud solution in Oracle Cloud Infrastructure that lets you index, enrich, aggregate, explore, search, analyze, correlate, visualize and monitor all log data from your applications and system infrastructure.
Oracle Logging Analytics provides multiple ways of gaining operational insights from your logs. So that you can find the “needle in the haystack” among millions of log records:
- Fully integrated data log analytics and exploration
- Visualize and analyze log patterns
- Topology-aware exploration
- Curated Machine Learning algorithms
- Rich collection(250+) out-of-box parsers for all log types
- Easy data archival and recall
- Long-term retention at low cost
With log data fully ingested into Logging Analytics, we can perform analysis on these log data to get operations insight information from custom built dashboards.
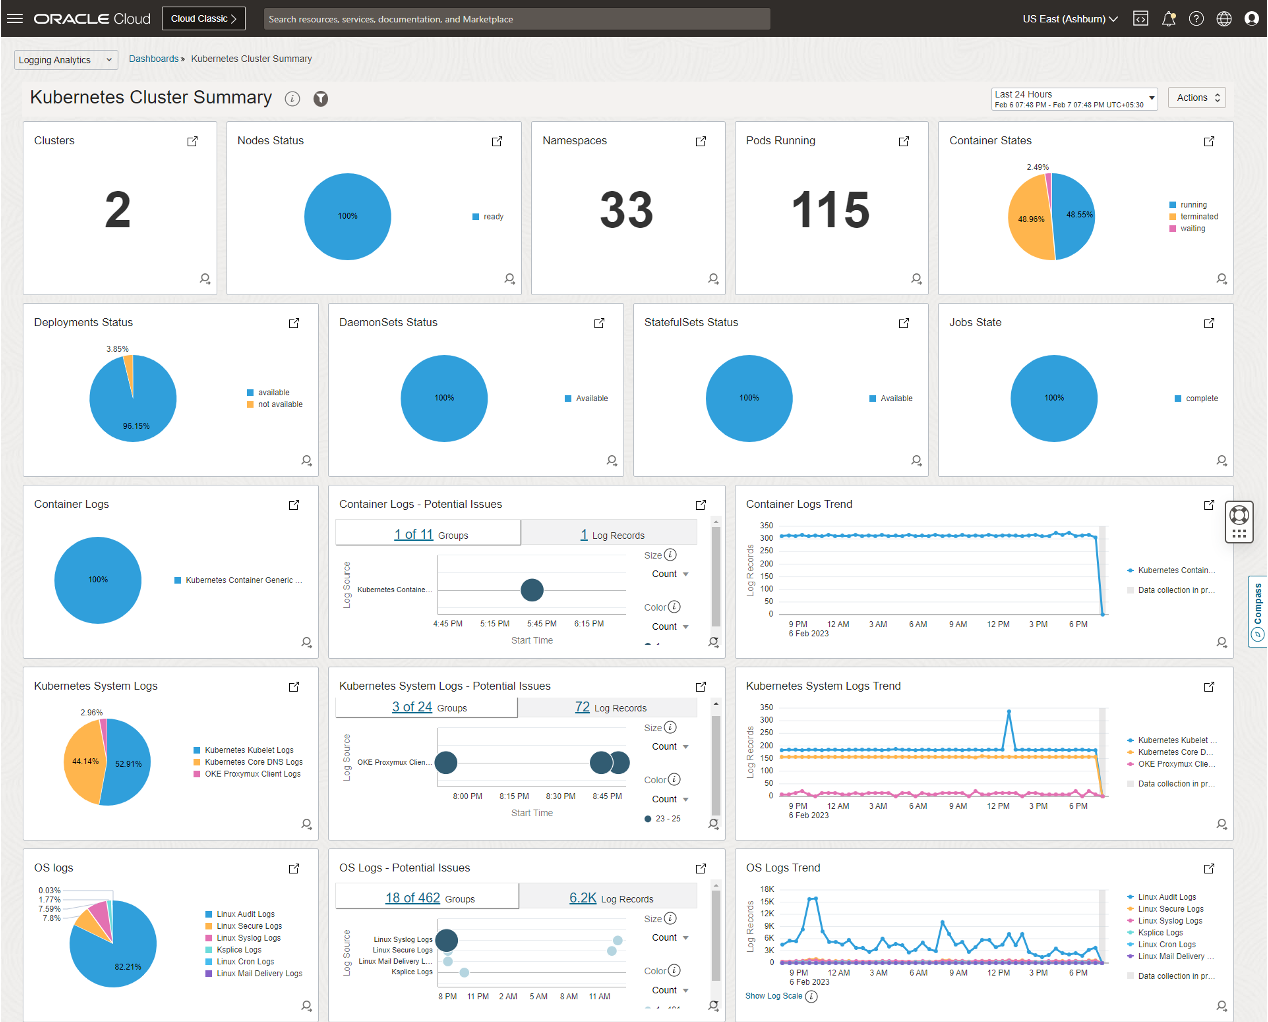
For example, Site Reliability Engineers(SRE) can have a single view of Kubernetes Cluster summary:
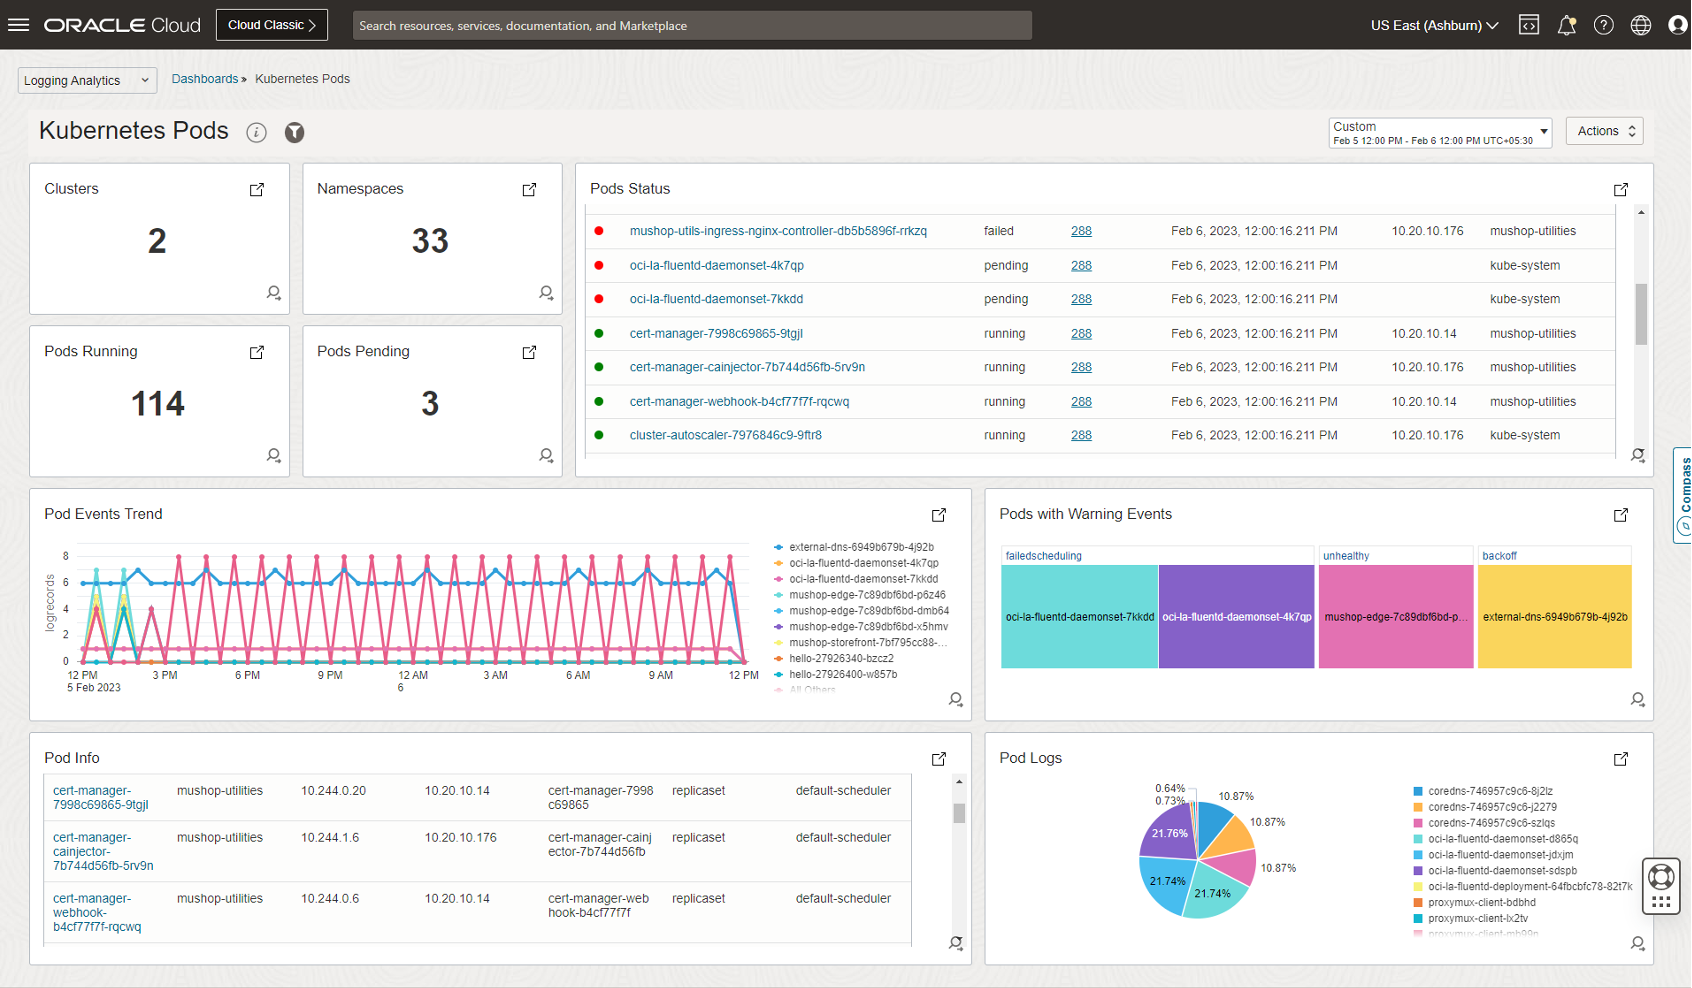
Or even look into the Kubernetes Pods status:
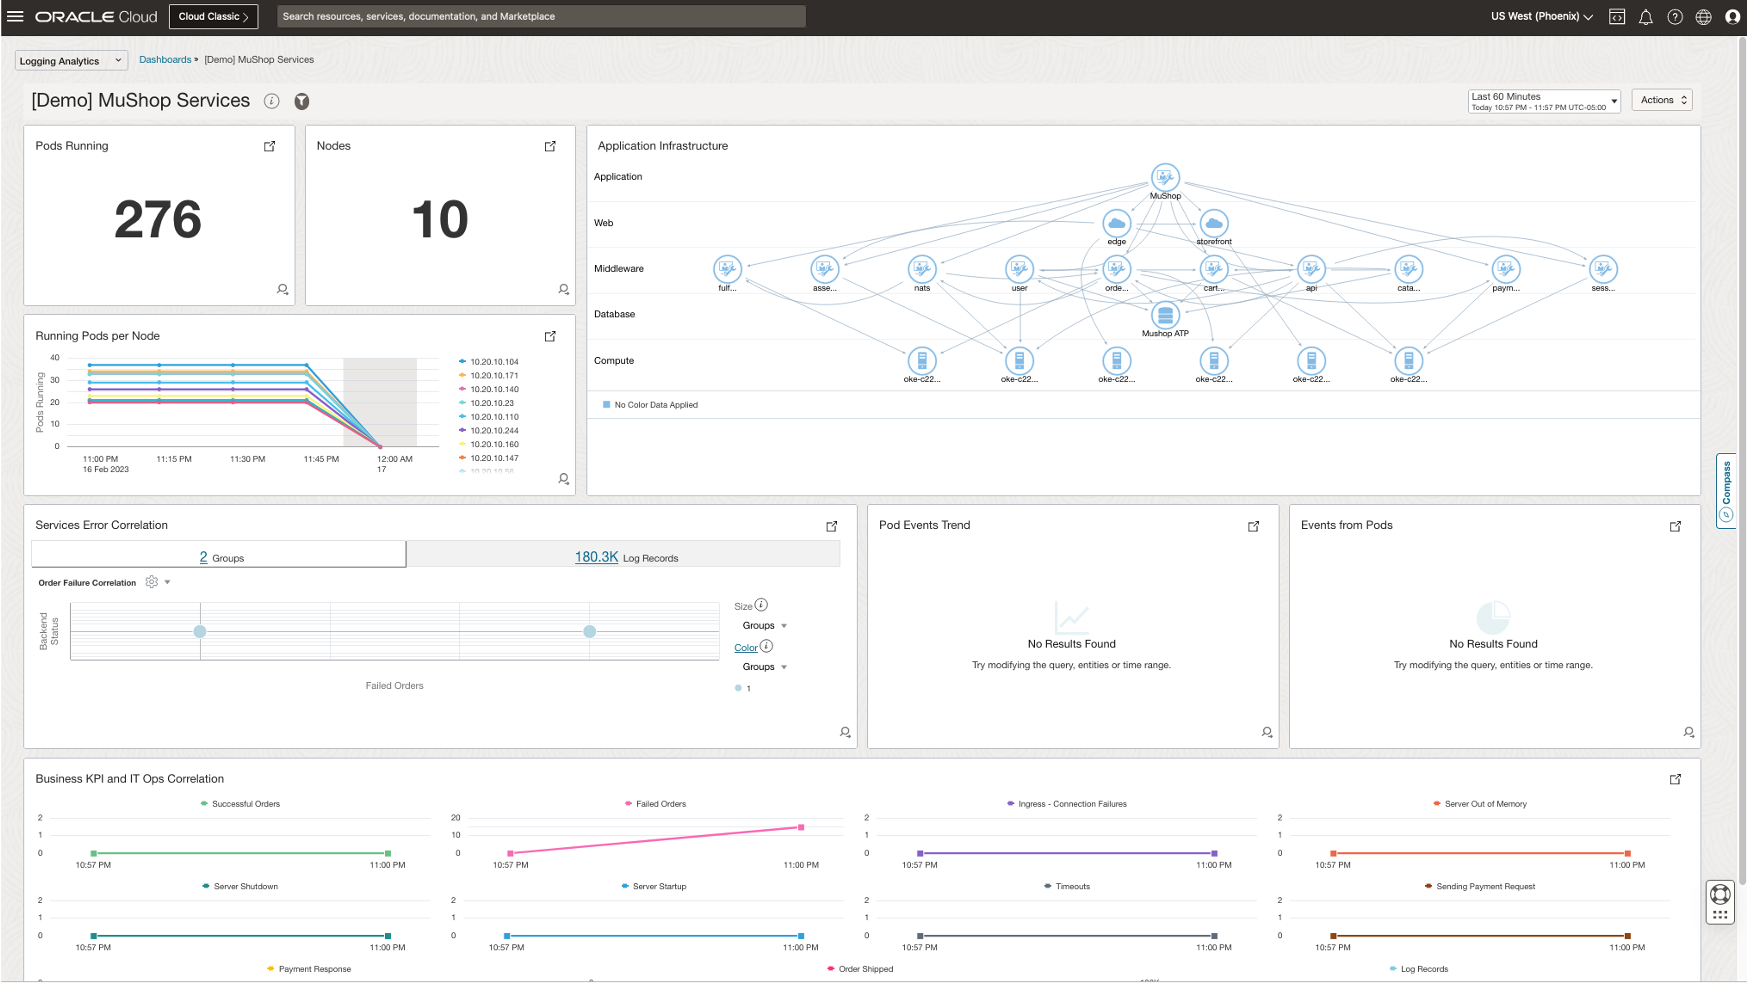
and Application workload performance:
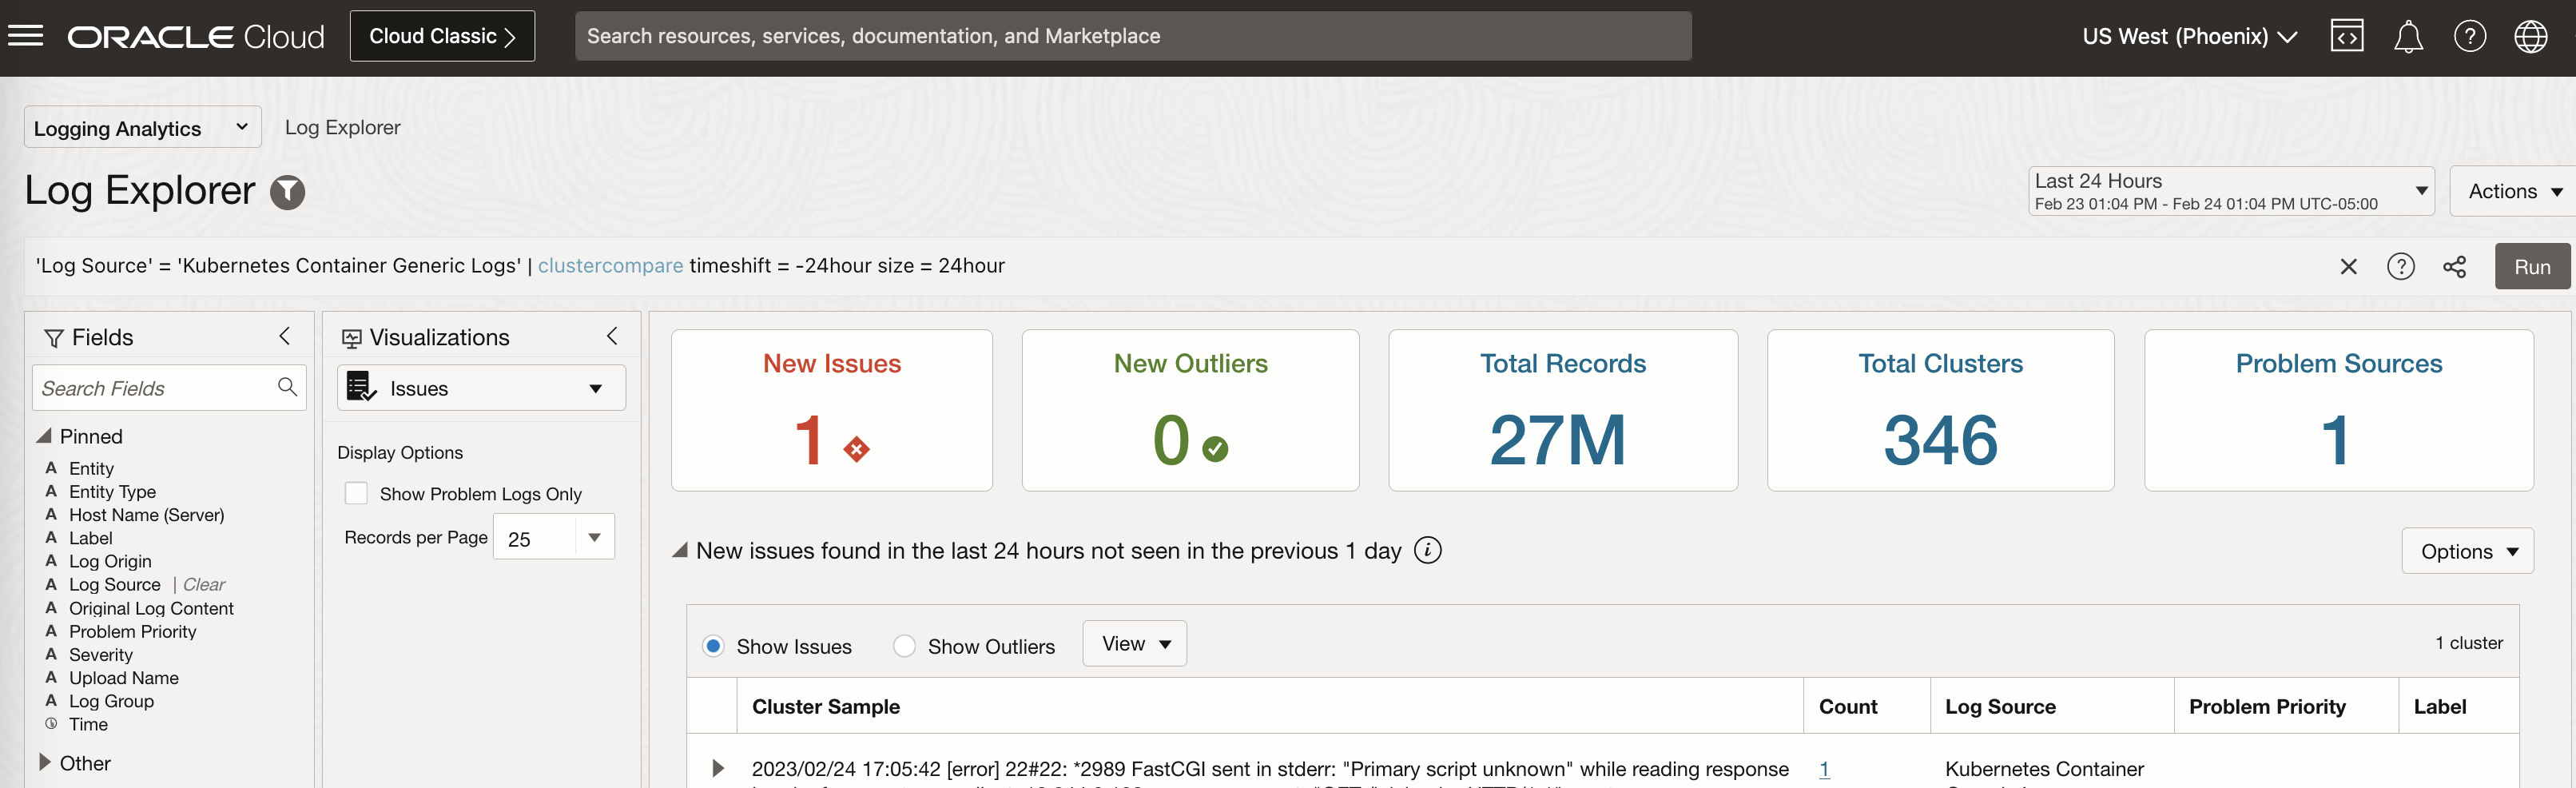
For specific issue on the dashboard, SRE or production support engineers can quickly drill down into the logs and use predefined machine learning capabilities to identify the anomaly and issues pattern from the log data.
Cost Management
The cost analysis of enabling Logging and Monitoring services and Logging Analytics in OCI can vary depending on the assumptions that we set for the stage, such as the nubmer of the log sources, size of generated logs and monitoring datapoints, here are a few of factors you might want to consider when building your cost analysis model:
- Determine the volume of log data you expect to generate. This will depend on the size and complexity of your OKE cluster and the number of applications and services running on it.
- Sample your existing OKE cluster logs to estimate the average size of a log message and multiplying it by the number of log messages generated per second.
- Sample your custom metrics datapoints to estimate the volumne of datapoints per OKE cluster.
- Review the pricing details for each service to understand the tier pricing cost structure.
You can always find details of Observability and Management Platform Pricing from here.
Logging Analyitics Cost
Logging Analytics service is charged on the volume of data in active and archival storage. First 10 GB of the log storage is free. When you check the pricing information for Logging Analytics, you will find that it’s charged based on Logging Analytics Storage Unit:
One Logging Analytics Storage Unit Per Month is defined as 300 GB of logs storaed during a month of the OCI Logging Analytics.
In order to be allow troubleshooting of day to day issues and get benefits of anomaly detection, pattern detection and other ML capabilities - we recommend active storage period of 90 days and moving logs older than 90 days to archival storage. Logs from archival stored can be recalled on demand quickly.
Logging Cost
Logging service is charged on the volumne of data in log storage. First 10 GB is free per month.
Monitoring Cost
Monitoring service is charged based on the number of Ingestion and Retrieval datapoints. For all internal service metrics, the monitoring service is free. For all additional custom metrics, it has first 500 million datapoints free for ingestion and retrieval.
Notification Cost
Notification service is charged based on the nubmer of delivery operations per months. Notification service can deliver topics to following subscriptions:
- Function
- HTTPS
- PageDuty
- Slack
- SMS
First 1 million delivery operations per month is free. Frist 1000 emails per month is free.
Conclusion
Effective logging and monitoring are crucial to maintaining the performance and availability of applications on Oracle Kubernetes Engine (OKE). By setting up customized logging and monitoring components, businesses can proactively detect and troubleshoot issues within their cloud native applications as well as the underlying Kubernetes clusters and computing infrastructures, minimizing the impact on end-users. Furthermore, by leveraging OCI Logging Analytics, OKE users can benefit from an integrated log management and analytics solution, featuring scalable storage, powerful analysis capabilities, and seamless integration with other OCI services. This robust combination of logging and monitoring helps ensure that organizations can efficiently monitor, secure, and optimize their cloud environments for optimal performance.