Publish Custom Metrics using OCI CLI
I have covered how to use Java SDK to publish custom database metrics to OCI Monitoring service, folks who followed my blog How to Publish Custom Metrics to OCI Monitoring Service found it difficult for a quick lab demo project setup. BTW, if you want to use another OCI SDK flavor Python to publish custom metrics to OCI Monitoring service, you can refer to Alfredo’s blog Extract OCI Monitoring Metrics Using REST APIs.
In today’s blog, I would like to walk through the steps with you to create a quick testing case to capture the host level java processes count and publish the process count as a custom metrics to OCI Monitoring service.
Prerequisites
In order to publish custom metrics, you must have required type of access in a policy created by an administrator. This requirement applies whether you’re using the REST API with an SDK, CLI or other tools. If you get a message that you don’t have permission or are unauthorized, check with the administrator. You might not have the required type of access in the current compartment.
If you use your user’s OCI API key to publish custom metric, the following permissions allow your group to publish custom metrics to a metric namespace, as well as view metric data, create alarms and topics, and use streams with alarms.
Allow group <group_name> to use metrics in tenancy where target.metrics.namespace=<metric_namespace>'
Allow group <group_name> to read metrics in tenancy
Allow group <group_name> to manage alarms in tenancy
Allow group <group_name> to manage ons-topics in tenancy
Allow group <group_name> to use streams in tenancy
If you want your compute instances or other cloud resources to monitor metrics via API calls, then you can enable the instance principle or resource principal via dynamic group.
- Add the resources to a dynamic group using its matching rules.
- Create a policy that allows that dynamic group to access metrics.
Allow dynamic-group <dynamic_group_name> to read metrics in tenancyor more information about compute instances calling APIs, see Calling Services from an Instance
Capure and Collect your Metrics
Before publish the custom metrics to OCI Monitoring service, you need to first collect the data for publishing the custom metrics. You can collect your metrics based on your monitoring requirements.
- Monitor java processes running on the host
procCount=`/usr/bin/ps -ef | grep java | grep -v "grep" | grep -v "java_process_monitor" |  wc -l`
echo ${procCount}
Construct your OCI monitoring service payload
Oracle doc provides the example JSON file for request. A few key elements in the JSON template is
- OC_TELEMETRY_URL
- COMPARTMENT
- TIMESTAMP with format $(date -u +”%Y-%m-%dT%H:%M:%S+00:00”)
- NAMESPACE
- RESOURCENAME
- COMPUTERESOURCEID
# Create a JSON file with the metric data
cat <<EOF>oci_metric_data.json
[
  {
    "compartmentId": "${COMPARTMENT}",
    "datapoints": [
      {
        "timestamp": "${TIMESTAMP}",
        "value": ${procCount}
      }
    ],
    "dimensions": {
      "resourceName": "${RESOURCENAME}",
      "computeResourceId": ${COMPUTERESOURCEID}
    },
    "metadata": {
      "category": "CustomMetrics"
    },
    "name": "${METRICNAME}",
    "namespace": "${NAMESPACE}",
    "resourceGroup": "${RESOURCEGROUP}"
  }
]
EOF
Publish Custom Metrics
Use the oci monitoring metric-data post command, the –endpoint parameter refers to telemetry-ingestion endpoint to publish custom metrics.
oci monitoring metric-data post --metric-data file://oci_metric_data.json --endpoint "${OC_TELEMETRY_URL}"
Query the Published Custom Metrics and Create an Alarm
- After successfully publish custom metrics, you can Query the Published Custom Metrics
-
Visualize the published custom metrics in Monitoring Metrics Explorer
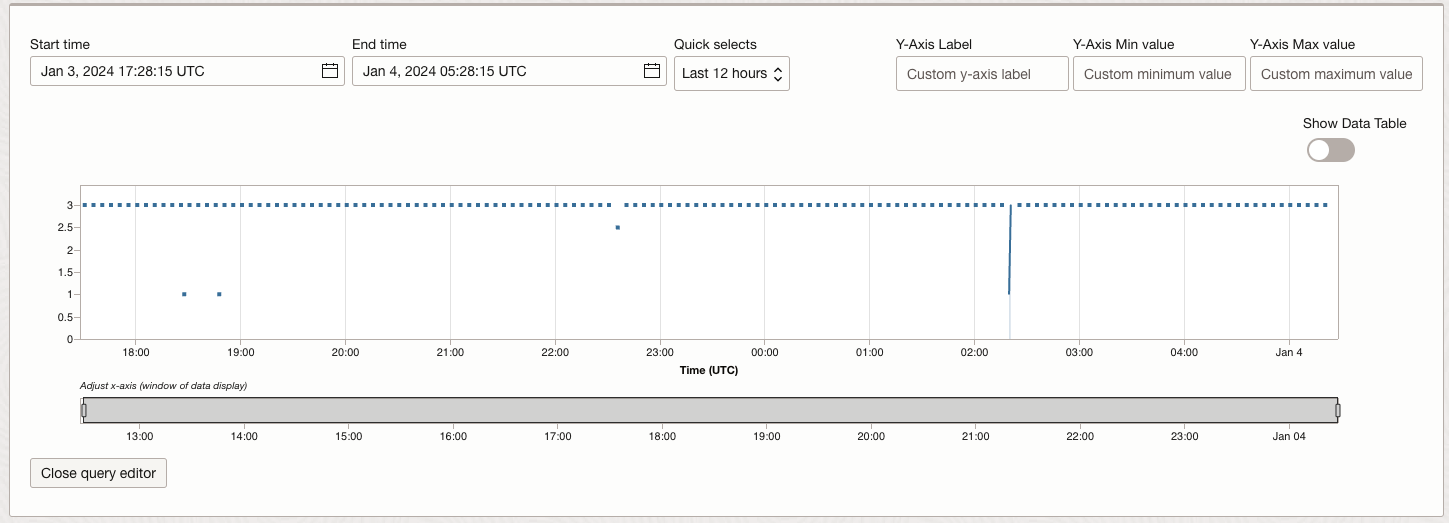
- Create an Alarm for Custom Metrics to get an email or ITSM alert when the metrics threashold is exceeded
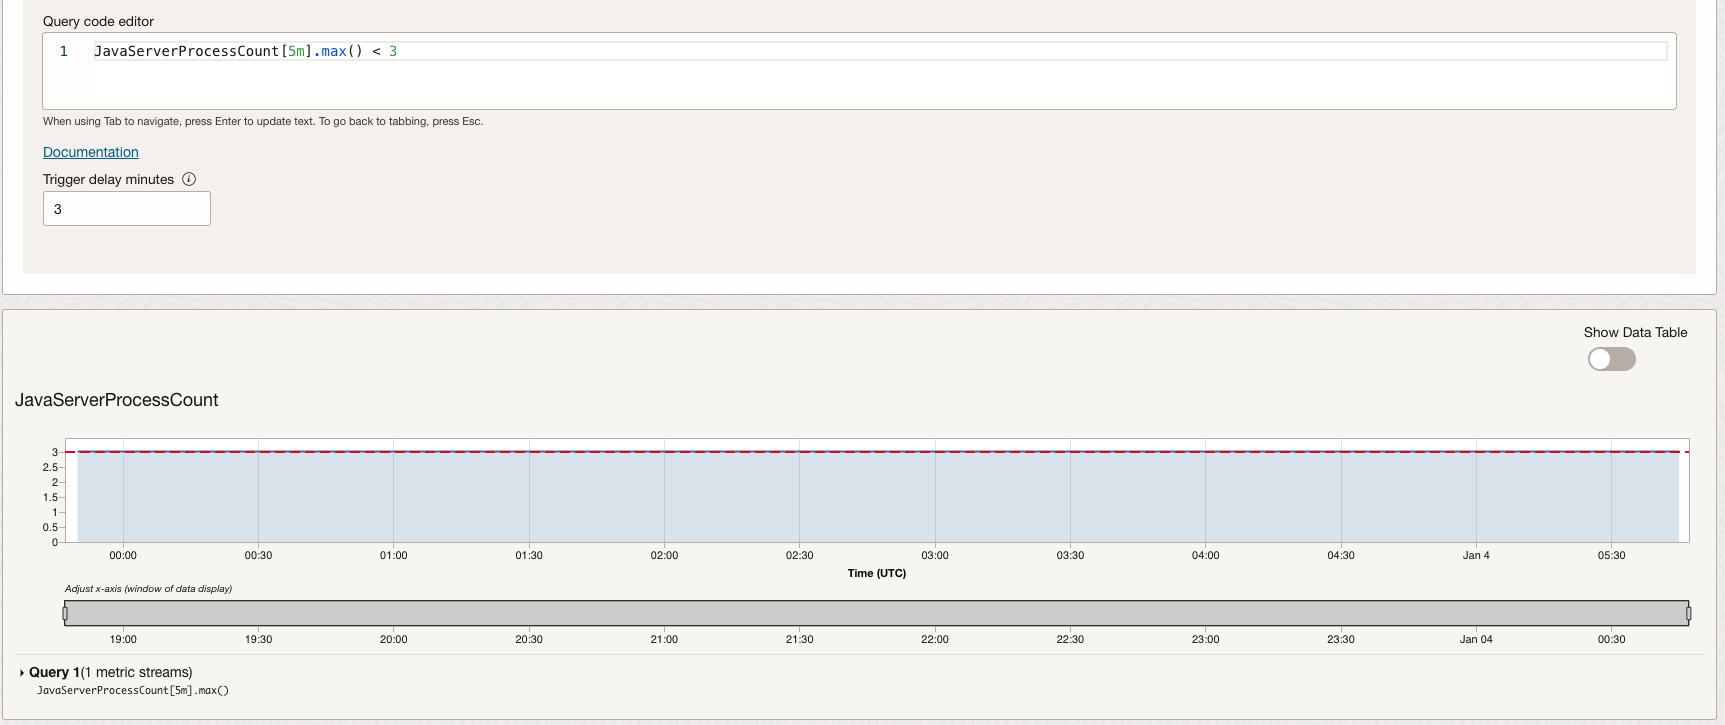
Considerations when publishing custom metrics
- For the metric namespace, don’t use a reserved prefix (oci_ or oracle_).
- Ensure that custom metrics don’t exceed limits. For example, note the valid range of dimensions and maximum number of streams for custom metrics.
- Define metrics with aggregation in mind. While custom metrics can be posted as frequently as every second (minimum frequency of one second), the minimum aggregation interval is one minute.
- Define metrics with return limits in mind. Limits information for returned data includes the 100,000 data point maximum and time range maximums (determined by resolution, which relates to interval). See MetricData. See also Limits on Monitoring.
- Ensure that timestamp values are near current time. For a data point to be posted, its timestamp must be near current time (less than two hours in the past and less than 10 minutes in the future). See PostMetricData.
- After publishing custom metrics, you can access them the same way you access any other metrics stored by the Monitoring service: View charts in the Console, query metrics using the CLI or API, and create alarms.
- When retrieving custom metrics, you can match to a resource group. Blank (null) for resource group returns metric data that doesn’t have a resource group.